You review a part drawing at your workstation. The supplier claims the metal bracket can handle the load, but you wonder: will it bend permanently or snap under repeated use? Many new engineers face this exact doubt when checking designs or troubleshooting failures.
Stress and strain are the core concepts that solve this problem. Read this guide and you will clearly understand stress and strain in materials. You will learn the exact definitions, the key differences, how to calculate them, what the stress-strain curve shows, and how these ideas help you make better material choices on the job.
In materials engineering, stress and strain predict whether a component will survive daily loads or fail unexpectedly. Real-world tests show that ignoring stress and strain leads to over 20% of mechanical failures in early design stages.
Keep reading for straightforward explanations, simple analogies, practical formulas, and steps you can apply immediately.
What Is Stress in Materials?
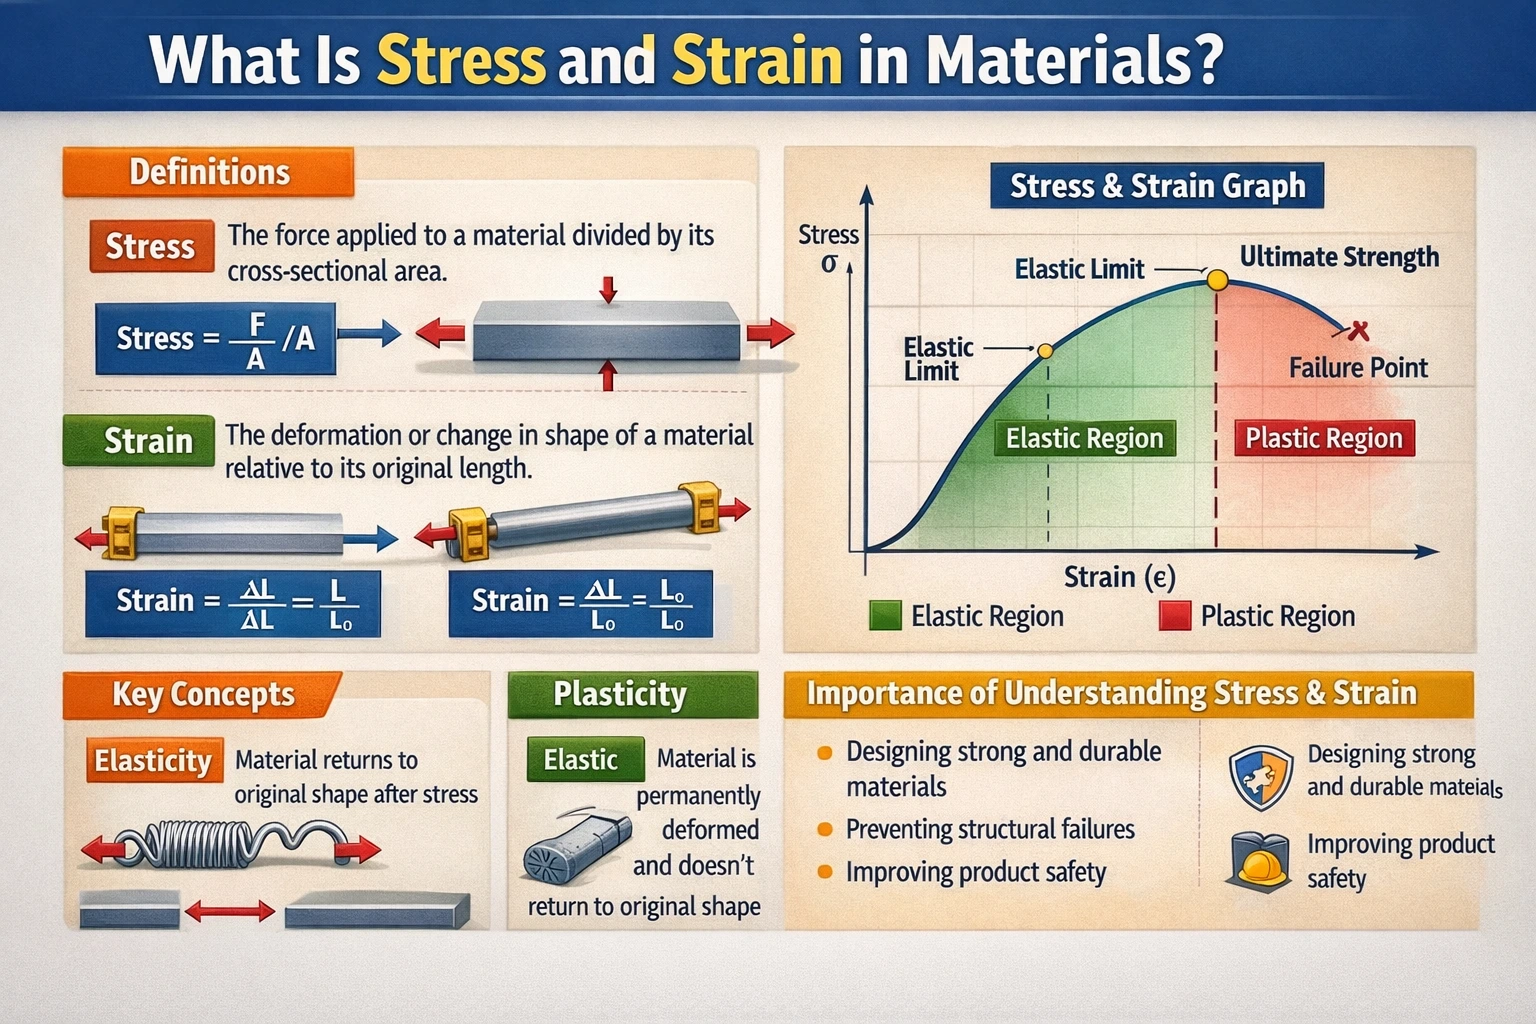
Stress is the internal resistance force per unit area that a material generates to resist an external load.
Think of it like this: when you pull on a rubber band, the material pushes back internally. Stress measures that push-back intensity. Engineers calculate it as force divided by cross-sectional area.
Conclusion first: Always calculate stress first to know if a material stays safe under load.
Why does this matter to you? In your daily work, stress values tell you whether a beam, shaft, or bracket will hold without breaking — preventing costly redesigns or accidents.
Types of Stress You Will Encounter
- Tensile stress (pulling or stretching force) — like towing a trailer with a chain.
- Compressive stress (pushing or squeezing force) — like a column supporting a roof.
- Shear stress (sliding force) — like scissors cutting paper.
Start with tensile and compressive for most beginner projects.
Why does this matter to you? Matching the right stress type to your application helps you select materials that last longer in real service.
How to Calculate Basic Stress
Use this simple formula:
Stress (σ) = Force (F) / Area (A)
Units are usually megapascals (MPa). One MPa equals about 145 psi.
Practical tip: Convert all units consistently before calculating. A small mistake here can lead to big safety issues.
Chapter takeaway: Stress normalizes force by area so you can compare materials fairly, regardless of part size.
Understanding Stress in Stress and Strain Analysis
Strain measures how much a material deforms under stress. It equals the change in length divided by the original length.
Imagine stretching a spring. The longer it gets compared to its starting length, the higher the strain. Strain has no units because it is a ratio.
Conclusion first: Strain shows the actual deformation, while stress shows the cause.
Why does this matter to you? You use strain to predict how much a part will stretch or compress in service — critical for fits, clearances, and avoiding interference in assemblies.
Normal Strain vs Shear Strain
- Normal strain changes length (elongation or shortening).
- Shear strain changes angles (twisting or sliding layers).
For most entry-level work, focus on normal strain along the load direction.
Practical use steps:
- Measure original length.
- Apply load and measure new length.
- Subtract and divide by original: Strain (ε) = ΔL / L₀
Why does this matter to you? Small strain values often mean the part returns to shape. Large values signal permanent damage.
Chapter takeaway: Strain turns invisible deformation into a number you can track and control.
The Stress-Strain Curve: Your Roadmap to Material Behavior
The stress-strain curve plots stress on the vertical axis and strain on the horizontal axis. This graph reveals how a material behaves from first touch to final break.
Conclusion first: The shape of the stress-strain curve tells you if a material is stiff, ductile, or brittle.
Why does this matter to you? Reading the stress-strain curve helps you choose steel for strength, aluminum for lightness, or rubber for flexibility — directly impacting product performance and cost.
Key Regions on the Stress-Strain Curve
- Elastic region (straight line at the start): Material returns to original shape when load is removed. Like a rubber band snapping back.
- Yield point: Stress level where permanent deformation begins.
- Plastic region: Material deforms permanently but still carries load.
- Ultimate strength: Highest stress before necking or breaking.
- Fracture: Complete failure.
Common analogy: Pulling taffy candy. It stretches easily at first (elastic), then flows permanently (plastic), and finally snaps.
Technical Parameters Explained Simply
| Parameter | Simple Explanation | Typical Value Example |
|---|---|---|
| Young’s Modulus (E) | Stiffness — how much stress produces a given strain | Steel: ~200 GPa Aluminum: ~70 GPa |
| Yield Strength | Stress at which permanent bending starts | Mild steel: ~250 MPa |
| Ultimate Tensile Strength | Maximum stress the material can withstand | Mild steel: ~400-550 MPa |
Young’s Modulus follows Hooke’s Law in the elastic region: Stress = Young’s Modulus × Strain.
Why does this matter to you? A high Young’s Modulus means the material resists deformation well — useful for rigid machine frames. Lower values suit parts that need to flex.
Chapter takeaway: Master the stress-strain curve and you can predict failure before it happens in prototypes or field use.
How to Use Stress and Strain in Real Work Situations
Conclusion first: Calculate expected stress, compare it to material limits using the stress-strain curve, and apply a safety factor.
Why does this matter to you? This process turns vague worries into confident decisions when approving drawings or suggesting material changes.
Step-by-Step Judgment Process
- Identify the load type and magnitude.
- Determine the critical cross-sectional area.
- Calculate stress: σ = F / A.
- Find the material’s yield or ultimate strength from data sheets.
- Apply safety factor (often 1.5 to 4 depending on industry).
- Check if calculated stress stays well below the limit and review expected strain.
Practical example: A 10 kN force on a 200 mm² steel bar gives stress of 50 MPa. Mild steel yields at 250 MPa, so it stays safe with room to spare.
Common mistake to avoid: Using the wrong area (original vs. reduced during necking) or forgetting temperature effects on stress and strain behavior.
Chapter takeaway: Consistent stress and strain checks reduce redesign loops and improve product reliability.
Quick Comparison: Different Materials Under Stress and Strain
Steel handles high stress with moderate strain. Aluminum offers good strength at lower weight but shows more strain. Plastics allow large strain before breaking but have lower overall stress capacity.
Why does this matter to you? You can now recommend the right material instead of defaulting to the cheapest or most familiar option.
What You Can Do Right Now
After reading this, you should be able to:
- Define stress and strain in plain terms.
- Sketch a basic stress-strain curve and label key points.
- Calculate simple stress and strain for a straight bar under tension.
- Compare two materials using Young’s Modulus values.
Immediate action step: Pick one part from your current project. Estimate the load, measure the critical area, calculate stress, estimate strain, and compare both to the material’s limits on the datasheet. Adjust if needed.
For further learning, study free university open-courseware lectures on mechanics of materials. Practice plotting your own stress-strain curves from simple tensile test data you find online. Small daily practice builds the intuition that separates average technicians from strong engineers.
FAQ
What is the difference between engineering stress and true stress?
Engineering stress uses the original cross-sectional area. True stress uses the actual (changing) area during deformation. True stress is more accurate for large strain in plastic forming processes, while engineering stress works fine for most design checks within elastic limits.
How does temperature affect stress and strain behavior?
Higher temperatures usually lower Young’s Modulus and yield strength, making materials softer and more prone to creep (slow permanent deformation under constant stress). Always check material data at the expected operating temperature, especially for engines or outdoor equipment.
Can the same material have different stress-strain curves?
Yes. Heat treatment, manufacturing process, and load direction (grain orientation) change the stress-strain curve. For example, cold-rolled steel is stronger but less ductile than hot-rolled. Always verify properties for the exact grade and condition you plan to use.
Why do we use a safety factor with stress calculations?
Real loads vary, materials have slight defects, and calculations include assumptions. A safety factor (extra margin) prevents unexpected failure when stress and strain behave differently than expected. Beginners should start with 2–3 for static loads and higher for dynamic or fatigue situations.
Is Hooke’s Law valid for all materials?
Hooke’s Law (stress proportional to strain) holds only in the elastic region for most engineering materials. Beyond the yield point or in rubber-like materials, the relationship becomes nonlinear. Know the elastic limit before applying the simple formula.